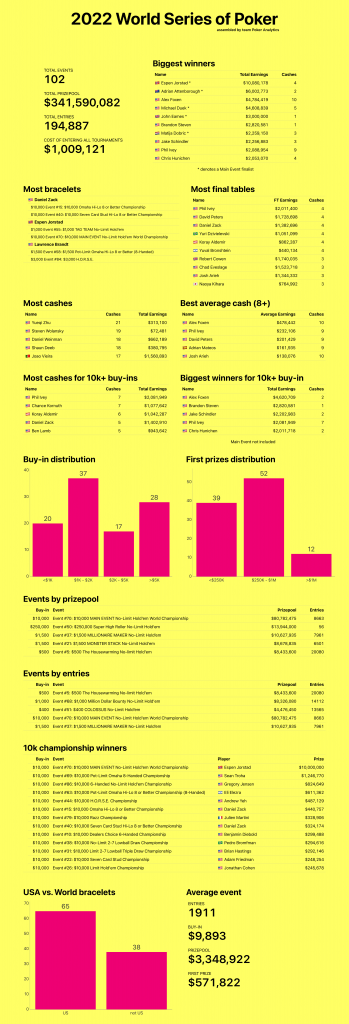
The WSOP are sadly already over, but we can rejoice to have a look at all the stats it brings us, and also notice how great the attendance was this year!
Here is the link of last year’s infographic, if you want to compare the stats. We’ve seen an increase of nearly 50% in total number of entries and prizepool.
As expected, more people makes winning two bracelets more difficult, a feature only three players made this year. Same with the most final tables count, capped at 4 this year, far from the sick Phil Hellmuth run of 7 last year.
Enjoy!

