
We’ve just released a new feature in Poker Analytics, the variance simulator.
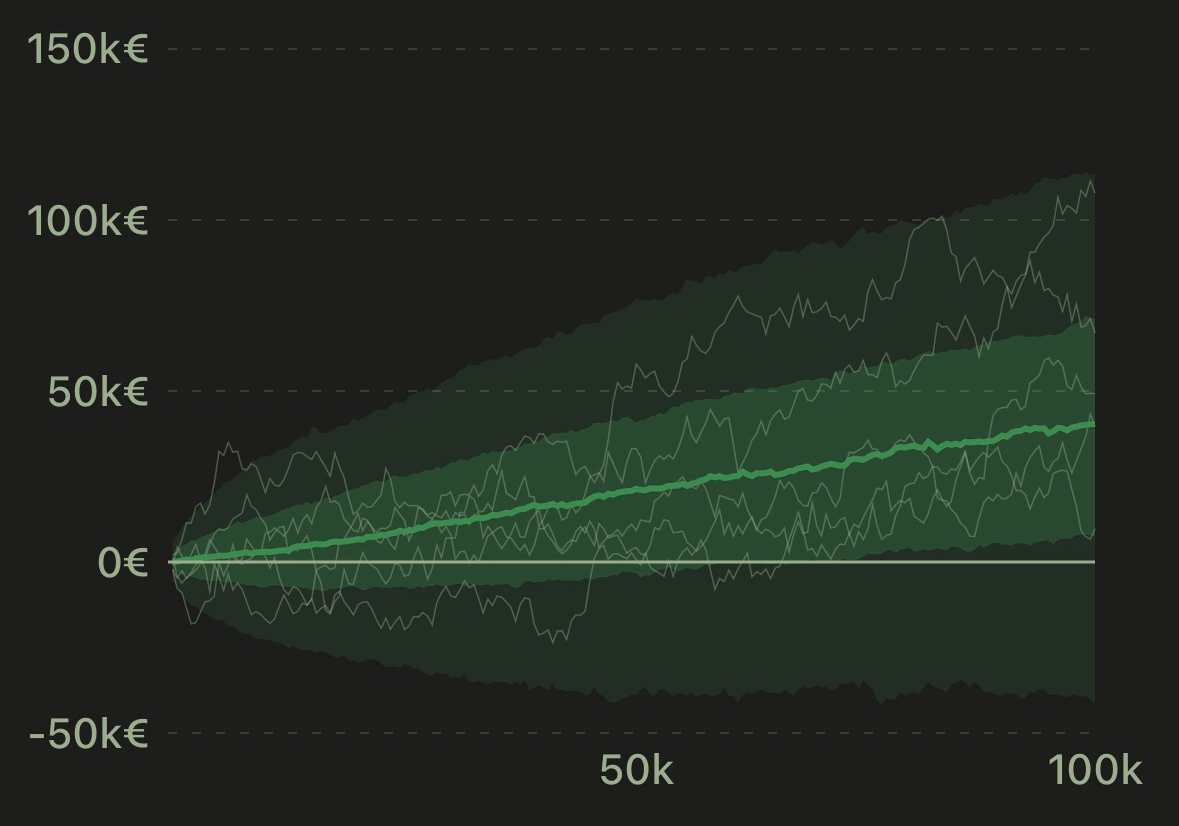
The variance simulator is a great way to visualize how a theoretical win rate is not a proof of smooth sailing in poker. Players with a theoretical negative win rate can become winners, and players that could win become losing players.
It’s a good way to remind yourself that downswings exists and that most players will experience one at least once in their career.
To access the simulator, you need to go to the Stats tab and look for the cash game standard deviation in BB/100 stat. We’ve added a small badge to let you know it’s there.

The simulator auto-populates the parameters with your own values. What’s great is that in the Stats tab you can filter your data if you want to refine more realistic values and see what’s going on.
You can also directly edit each parameter with the values you want to play with.
We’ve moved the risk of ruin stat to also let you play with parameters and have a better idea of your real risk, because sometimes certain sessions can have a tremendous impact on your stats. Typically, if you have a session with a zero duration, that session will probably have an unusual BB/100, skewing your standard deviation. Filtering out your shortest sessions is a good way to get a more realistic standard deviation.
We’ve also added a table to see the bankroll you need for a certain level of risk. Let us remind you to always play within your means and don’t forget to step back when you’re hitting a high risk of ruin.

That’s it for version 6.11! We’re always happy to hear from you, so please let us know your feedback.